
Feelings in Alberta
Jared Wesley | University of Alberta | jwesley@ualberta.ca
Clare Buckley | University of Alberta | cbuckley@ualberta.ca
April 22, 2020
Introduction
Both within the province and throughout the rest of the country, there is a lot of talk about how Albertans are feeling these days. Our survey brings us closer to understanding the different sentiments Albertans have about being Albertan and the province’s place in Canada. This research brief explores these issues by looking at feelings in Alberta. Do Albertans feel that people like them are falling behind in Alberta society? Do they think Alberta is treated with the respect it deserves in Canada? Are Albertans pessimistic about the province’s economic future over the next 10 years? Evidence from the Viewpoints Alberta Survey (1) shows that Albertans perceive a loss of status and feel disrespected within Canada. While almost half of respondents feel pessimistic about the province’s economic future, one-third of respondents are not as confident that the future is so bleak.
Falling behind
Viewpoint Alberta survey respondents were asked their agreement with the following statement: “People like me are falling behind in Alberta society”. In examining the overall results, more than half of respondents (58%) agree, with 26% answering that they strongly agree. Only 15% disagree, with less than 5% strongly disagreeing. More than a quarter of respondents were more neutral or undecided, with 27% answering that they neither agree nor disagree.
Figure 1: People like me are falling behind in Alberta society

Demographic groups
Although the majority of respondents answered in agreement that ‘People like me are falling behind in Alberta society’, men were slightly more likely than women to respond that they agree (61% to 55%). Women were slightly more likely than men to respond both that they disagree (16% to 13%) and that they neither agree nor disagree (29% to 26%). When examining the differences in responses based on ethnicity, white respondents and non-white respondents both agree at the same percentage (59%); however, white respondents were slightly more likely to disagree compared to non-white respondents (16% compared to 12%).
Figure 2: People like me are falling behind in Alberta society

Figure 3: People like me are falling behind in Alberta society

Respondents were categorized by the generation in which they were born: Silent Generation, Baby Boomers, Gen X, Millennials, and Gen Z (2). Middle-aged respondents were more likely than those in both younger and older generations to agree to the statement that they are falling behind. Those in Gen X were the most likely to answer that they strongly agree (34%), compared to 18% of Gen Z, 27% of Millennials, and 25% of Baby Boomers. Less than half of those in Gen Z agree (45%), with almost one-third answering neither agree nor disagree.
Figure 4: People like me are falling behind in Alberta society

Feelings of falling behind vary with household income and education levels, though in a non-linear manner: while those with the lowest income and the lowest level of education attained felt most strongly, with 35% and 37% strongly agreeing respectively, those with the highest income brackets and highest level of education attained were not the least likely to disagree. Instead, respondents with household incomes between 76 to 125K and those with a high school degree were the least likely to agree.
Figure 5: People like me are falling behind in Alberta society

Figure 6: People like me are falling behind in Alberta society

Partisan and ideological identification
Respondents identifying with the United Conservative Party had the highest percentage of agreement that they were falling behind (64%), compared to Liberals (60%), and New Democrats (54%). Similarly, those on the left are less likely to feel that people like themselves are falling behind, whereas those who place themselves on the right side of the spectrum are more likely to feel that they are falling behind.
Figure 7: People like me are falling behind in Alberta society

Figure 8: People like me are falling behind in Alberta society
Provincial Respect
To ascertain whether Albertans feel disrespected, respondents were asked whether Alberta is treated with the respect it deserves in Canada. Only one-quarter of respondents agree, with a majority (75%) answering ‘no’.
Demographic groups
When broken down by demographic factors, non-white respondents were more likely to answer that Alberta is treated with the respect in deserves in Canada compared to white respondents (35% to 22%). Younger generations were also more likely to answer yes, with 39% of those in Gen Z agreeing, compared to 27% of Millennials, 24% of Gen Xers and 19% of Baby Boomers.
Figure 9: In your opinion, is Alberta treated with the respect it deserves in Canada?

Figure 10: In your opinion, is Alberta treated with the respect it deserves in Canada?

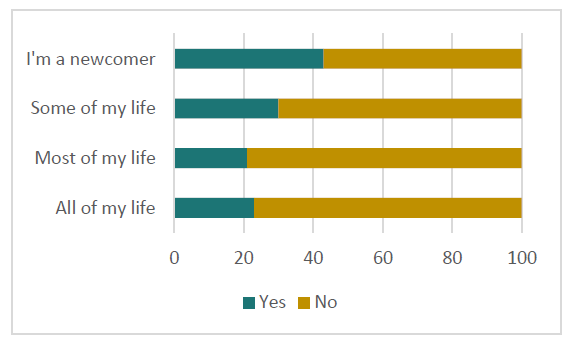
In addition, those living in urban and suburban communities were more likely to agree (27% and 26%) compared to those in rural communities (16%). When looking at how long the respondent has lived in Alberta, newcomers to the province were more likely to agree (43%) compared to those who have lived in Alberta for some of their life (30%), most of their life (21%), and all of their life (23%).
Figure 11: In your opinion, is Alberta treated with the respect it deserves in Canada?
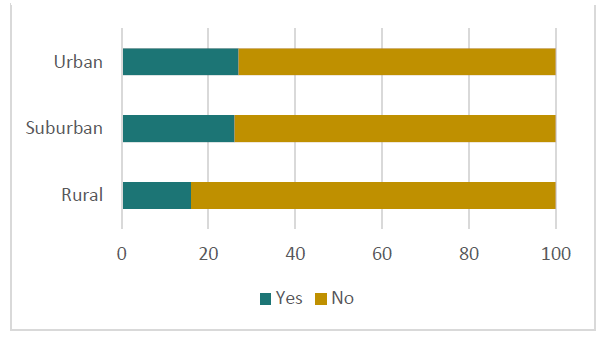
Figure 12: In your opinion, is Alberta treated with the respect it deserves in Canada?
Men and women do not differ significantly in their agreement (26% compared to 23%). Further, household income and education level attained do not significantly impact views.
Partisan and ideological identification
Views on Alberta being treated with the respect it deserves in Canada vary considerably by a respondents’ partisan identification. Both New Democrats (42%) and Liberals (44%) were more likely to agree that Alberta is treated with the respect it deserves. On the other hand, over 90% of United Conservatives did not think that Alberta is treated with the respect it deserves.
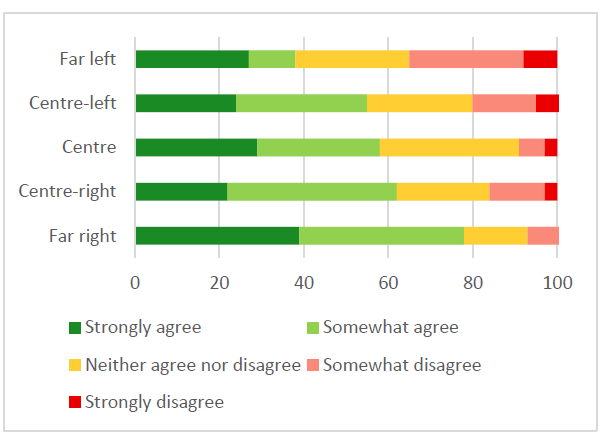
There is a linear relationship between where a respondent places themselves on a left-right spectrum and their view on whether Alberta is treated with the respect it deserves. Those on the far left (60%) and centre-left (46%) were more likely to feel that Alberta is treated with respect. However, those who place themselves on the centre are more closely aligned with the right side of the spectrum on this issue, with 21% responding yes, compared to 15% for centre-right and 9% for far right.
Figure 13: In your opinion, is Alberta treated with the respect it deserves in Canada?
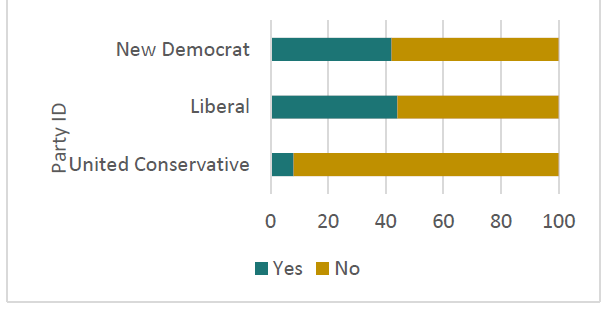
Figure 14: In your opinion, is Alberta treated with the respect it deserves in Canada?

Pessimistic
To determine how Albertans feel about the future provincial economic outlook, respondents were asked to rate their agreement with the statement: “When I think about Alberta’s economic future over the next 10 years I feel pessimistic”. Exactly half of respondents agree with this statement (50%). Many Albertans were also uncertain, with almost one-third (31%) answering that they neither agree nor disagree. Almost one-fifth (19%) of respondents disagreed.
Figure 15: When I think about Alberta’s economic future over the next 10 years I feel…Pessimistic

Demographic groups
Those who identify as living in suburban areas (54%) were the most likely to feel pessimistic about Alberta’s economic future, followed by those living in urban areas (50%). Interestingly, those living in rural areas were the least likely to feel pessimistic, with a large percentage of rural residents (40%) responding that they neither agree nor disagree.
Figure 16: Urban

Figure 17: Suburban
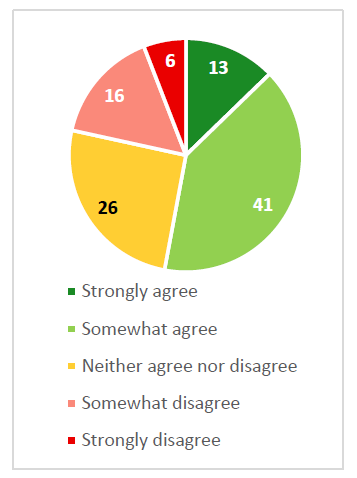
Figure 18: Rural

When looking at how long an individual has lived in Alberta, newcomers and those who have lived in Alberta for some of their life are less pessimistic than those who have lived in Alberta for most of their life or all of their life. Of all groups, newcomers to Alberta were the least pessimistic over the province’s economic future (38%) compared to those who have lived in Alberta for some of their life (43%), most of their life (54%), and all of their life (53%). More recent residents also felt more undecided, with 35% of newcomers and 34% of those who have lived in Alberta for some of their life answering that they neither agree nor disagree to feeling pessimistic.
Figure 19: When I think about Alberta’s economic future over the next 10 years I feel…Pessimistic

Women (52%) were more likely pessimistic than men (48%), and white respondents (51%) were more likely to be pessimistic than non-white respondents (46%). Millennials (52%), Gen Xers (51%), and those in Gen Z (50%) all responded with similar levels of pessimism, a couple percentages higher than Baby Boomers (47%).
There was little variation across different household income levels, though those in the highest bracket (over 126K) were the most likely to be pessimistic (59%). There was also little variation across different education levels, though those with less than a high school degree were the least pessimistic, with only 5% answering that they strongly agree.
Partisan and ideological identification
Respondents who identified with the United Conservatives were the most likely to feel pessimistic (55%). United Conservatives also felt this more strongly, with 23% of respondents answering that they strongly agreed to feeling pessimistic about Alberta’s economic future. Almost half (46%) of New Democrats also felt pessimistic, with those who identify as a Liberal feeling the least pessimistic (37%).
Feelings of pessimism are highest for those on the ends of the spectrum, with those in the centre feeling the least pessimistic (and most undecided). Half (50%) of those on the far left and 62% of those on the far right feel pessimistic. A majority of respondents (57%) on the centre-right also feel pessimistic. Among those who place themselves on the centre of the political spectrum, only 39% felt pessimistic, with almost half (45%) responding that they neither agree nor disagree to feeling pessimistic about Alberta’s economic future. Interestingly, those on the ends of the spectrum also had the highest percentage answering that they strongly disagree, with 11% of those on the far left and 9% of those on the far right.
Figure 20: When I think about Alberta’s economic future over the next 10 years I feel…Pessimistic
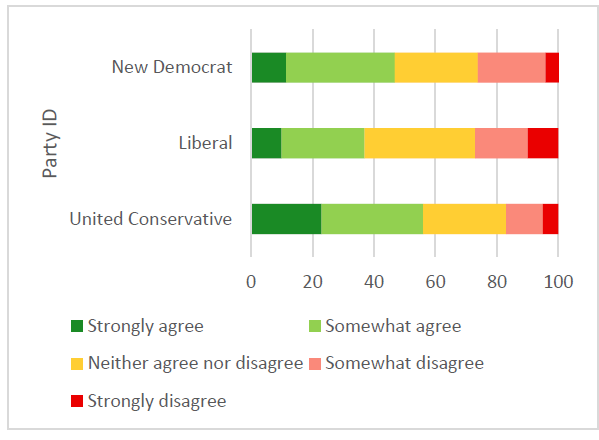
Figure 21: When I think about Alberta’s economic future over the next 10 years I feel…Pessimistic

Methodology of the Viewpoint Alberta Survey
The Viewpoint Alberta Survey was conducted between October 22 and November 21, 2019. The survey was deployed online by Qualtrics. A copy of the survey questions can be found here: https://bit.ly/2PvQV2C. Qualtrics co-ordinates the survey with an online panel system that targets registered panelists that meet the demographic criteria for the survey. Survey data is based on 820 responses with a 17-minute average completion time. The Viewpoint Alberta Survey was led by co-principal investigators Jared Wesley and Loleen Berdahl. It was funded by an Alberta-Saskatchewan Research Collaboration Grant from the Kule Institute for Advanced Study at the University of Alberta and the College of Arts and Science at the University of Saskatchewan.
Endnotes
The Viewpoint Alberta Survey was funded by an Alberta-Saskatchewan Research Collaboration Grant from the Kule Institute for Advanced Study (University of Alberta) and the College of Arts and Science (University of Saskatchewan). The survey was completed for the research team, led by co-principal investigators Loleen Berdahl and Jared J. Wesley. Neither the funding bodies nor the research team are responsible for the analyses or interpretations presented here.
Generational breakdown is as follows: Silent Generation: Born before 1944; Baby Boomer: Born 1944 to 1964 Gen X: Born 1965 to 1979; Millennials: Born 1980 to 1994; Gen Z: Born since 1995